Evolution makes good solid predictions, and they are born out by experiment and observation - the nested hierarchy is a great example. But it does not make the type of predictions you seem to be demanding. That would be like demanding that ID predict when God will next create a new species.Let's try one. Fill in the variables as predicted by your hypothesis: based on the average rate of mutation X, in the genome of species Y, the speciation event Z is predicted at S.
You are using an out of date browser. It may not display this or other websites correctly.
You should upgrade or use an alternative browser.
You should upgrade or use an alternative browser.
The origin of life: Cell membranes.
- Thread starter Cisco Qid
- Start date
Five Solas
Active member
Demanding. Why, Pix?Evolution makes good solid predictions, and they are born out by experiment and observation - the nested hierarchy is a great example. But it does not make the type of predictions you seem to be demanding. That would be like demanding that ID predict when God will next create a new species.
")
I understand, but this is important distinction, I think, as you keep using the phrase real science. The types of predictions you are noting are retroactive, not predictive in the manner that a physicist can predict where Mars will be in twenty years. And, yes, I do think it is an important distinction, to be fair, that ID cannot predict when God will next create a new species.
Gus Bovona
Well-known member
ASAIK, it doesn't matter whether a prediction says what will happen in the future or must have happened in the past. The important thing is that the prediction is a necessary consequence of the theory.Demanding. Why, Pix?
I understand, but this is important distinction, I think, as you keep using the phrase real science. The types of predictions you are noting are retroactive, not predictive in the manner that a physicist can predict where Mars will be in twenty years. And, yes, I do think it is an important distinction, to be fair, that ID cannot predict when God will next create a new species.
It is real science, and hence predicting something we already know is fine - in science, a prediction is a necessary consequence of the hypothesis, and can be confirmed by existing knowledge.Demanding. Why, Pix?
I understand, but this is important distinction, I think, as you keep using the phrase real science. The types of predictions you are noting are retroactive, not predictive in the manner that a physicist can predict where Mars will be in twenty years. And, yes, I do think it is an important distinction, to be fair, that ID cannot predict when God will next create a new species.
Arguably the most significant prediction of relativity was the orbit of Mercury. If relativity was true, that was what the orbit necessarily had to be. The fact that we already knew what the orbit was did not make the prediction any less convincing.
If evolution is true, then all organism must necessarily fall into a nested hierarchy. The nested hierarchy had already been proposed, but it was still a scientific prediction of evolution.
Five Solas
Active member
This illustrates my previous comment well, Pix. There's a mathematically predictive basis to some hypotheses that other lack. Not all hypotheses are created equally. I never said that meant they weren't science or properly hypothetical.It is real science, and hence predicting something we already know is fine - in science, a prediction is a necessary consequence of the hypothesis, and can be confirmed by existing knowledge.
Arguably the most significant prediction of relativity was the orbit of Mercury. If relativity was true, that was what the orbit necessarily had to be. The fact that we already knew what the orbit was did not make the prediction any less convincing.
If evolution is true, then all organism must necessarily fall into a nested hierarchy. The nested hierarchy had already been proposed, but it was still a scientific prediction of evolution.
At the end of the day, evolution is good science. It makes bold, testable predictions that are confirmed by experiment and observation.This illustrates my previous comment well, Pix. There's a mathematically predictive basis to some hypotheses that other lack. Not all hypotheses are created equally. I never said that meant they weren't science or properly hypothetical.
So what is your point? Do you actually have one?
Five Solas
Active member
Why don't you address the points I've made so far rather than asking if I have one in order to suggest I do not? There's a mathematically predictive basis to some hypotheses that other lack. Not all hypotheses are created equally.At the end of the day, evolution is good science. It makes bold, testable predictions that are confirmed by experiment and observation.
So what is your point? Do you actually have one?
At any rate, despite your cantankerousness, Pix, this actually is fairly interesting. I'll pick it back up with you and Gus Sunday evening.
Why do you not want to say what your point is?Why don't you address the points I've made so far rather than asking if I have one in order to suggest I do not?
Do you have a point? Does your argument rely on it being kept secret?
As far as I know, I have answered your questions. Looks to me like it is time for your big reveal.
If that is all you are saying, then yes. Some science can be expressed mathematically, some cannot. I really hope that was not the big reveal!There's a mathematically predictive basis to some hypotheses that other lack. Not all hypotheses are created equally.
Gus Bovona
Well-known member
For what it's worth, the twin nested hierarchies from morphology and molecular studies match to within 38 decimal points:Why don't you address the points I've made so far rather than asking if I have one in order to suggest I do not? There's a mathematically predictive basis to some hypotheses that other lack. Not all hypotheses are created equally.
At any rate, despite your cantankerousness, Pix, this actually is fairly interesting. I'll pick it back up with you and Gus Sunday evening.
SourceSo, how well do phylogenetic trees from morphological studies match the trees made from independent molecular studies? There are over 1038 different possible ways to arrange the 30 major taxa represented in Figure 1 into a phylogenetic tree (see Table 1.3.1; Felsenstein 1982; Li 1997, p. 102). In spite of these odds, the relationships given in Figure 1, as determined from morphological characters, are completely congruent with the relationships determined independently from cytochrome c molecular studies (for consensus phylogenies from pre-molecular studies see Carter 1954, Figure 1, p. 13; Dodson 1960, Figures 43, p. 125, and Figure 50, p. 150; Osborn 1918, Figure 42, p. 161; Haeckel 1898, p. 55; Gregory 1951, Fig. opposite title page; for phylogenies from the early cytochrome c studies see McLaughlin and Dayhoff 1973; Dickerson and Timkovich 1975, pp. 438-439). Speaking quantitatively, independent morphological and molecular measurements such as these have determined the standard phylogenetic tree, as shown in Figure 1, to better than 38 decimal places. This phenomenal corroboration of universal common descent is referred to as the "twin nested hierarchy". This term is something of a misnomer, however, since there are in reality multiple nested hierarchies, independently determined from many sources of data.
Can you be honest and show us how evo created information?Got to be honest,
rossum
Well-known member
Insertion mutations create information, as I have told you before, ferengi.Can you be honest and show us how evo created information?
Prove itInsertion mutations create information
rossum
Well-known member
Certainly.Prove it
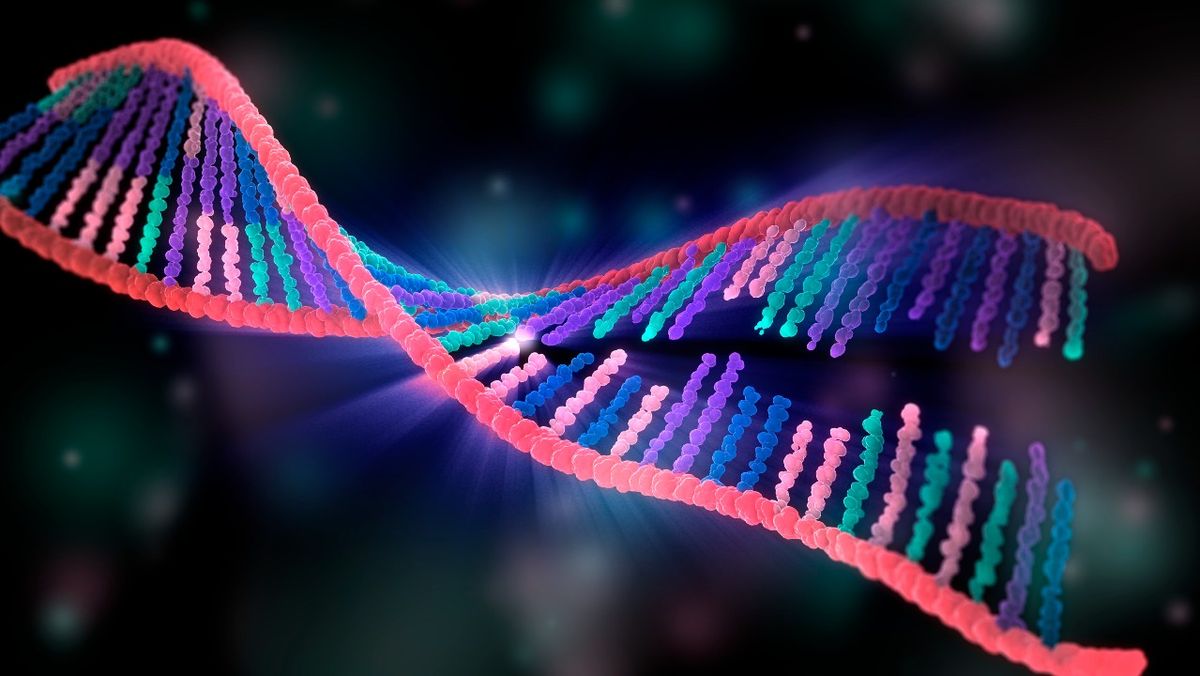
Take some DNA: GATTACA. That is 7 base pairs. Each base pair is 2 bits of Shannon information, giving a total of 14 bits of information in that short piece of DNA.
Now let an insertion mutation happen in that same piece of DNA: GATCTACA. That is now 8 base pairs. We now have 16 bits of information in the mutated DNA. Giving 2 new bits of information in the DNA from an evolutionary process; an insertion mutation.
Unsupported - what function does that direct? What new protein or enzyme is created?Certainly.
Take some DNA: GATTACA. That is 7 base pairs. Each base pair is 2 bits of Shannon information, giving a total of 14 bits of information in that short piece of DNA.
Now let an insertion mutation happen in that same piece of DNA: GATCTACA. That is now 8 base pairs. We now have 16 bits of information in the mutated DNA. Giving 2 new bits of information in the DNA from an evolutionary process; an insertion mutation.
rossum
Well-known member
You lose, ferengi. Your question, which I correctly answered, said nothing at al about "function", "protein" or "enzyme".Unsupported - what function does that direct? What new protein or enzyme is created?
Here is what you asked, and to which I provided a correct answer:
Can you be honest and show us how evo created information?
By altering you question after the event you show that you have lost the exchange, and that you know you have lost the exchange. You are trying to salvage something by altering the question, but your obvious dodge is very obvious.
Next time be more careful asking your question. That way you won't have to change the question after the event.
Prove it.Your question, which I correctly answered,
Avoiding the question- what function does that direct? What new protein or enzyme is created? you show that you have lost the exchange, and that you know you have lost the exchange. You are trying to salvage something by avoiding the question, but your obvious dodge is very obvious.
Will you prove THIS claim - or will you do what you always do and ignore your claims of blind religious faithShe claims - Random mutations produce DNA
Common sense tells you it would have taken trillions of tries before evolution got it right.Wow, REALLY?
Surely you can show us your work on this.
Maybe your deity poofed it into existence all at once from dust.
And I bet those 30 plus enzymes had to be protected from the elements in order to have formed?Good catch, Topic is cell membrane and they can't explain where the 30+ enzymes drifted in from to build the cell membrane. How were the enzymes built? Transported?
You may well be right. It took getting on for a billion years before life appeared on earth. If, somewhere across the planet, a try was made every hour, then that is indeed trillions of tries. To give some further context, if it needs lightning to spark it off, there are 16 million lightning storms across the world every year.Common sense tells you it would have taken trillions of tries before evolution got it right.
Again, you may well be right. There are various theories on that, as simple as forming in a rocky nook or inside clay. You might want to read this:And I bet those 30 plus enzymes had to be protected from the elements in order to have formed?
7 Theories on the Origin of Life
The answer to the origin of life remains unknown, but here are scientists best bets